Kutools for Excel 23.00 is released on Sep/2020! This version continues to pay attention to charts and brings 18 beautifully chart templates and 7 handy chart tools.
It redesigns the undo feature for processing huge data, and adds a handy Search feature for quickly locating the features and applying them.
Kutools development team devotes ourselves to bring a more convenient and easier experience for our users.
The Percentage ball chart will show the percentage of something occupied or remaining, or the completion percentage of a project.
A percentage ball chart is always used to represent the percentage complete towards a target in Excel as below demo shown.
How could you create this type of chart in Excel?
Kutools for Excel supports an amazing tool – Percentage Ball Chart, with this utility, you can quickly create a percentage ball chart in Excel workbook.

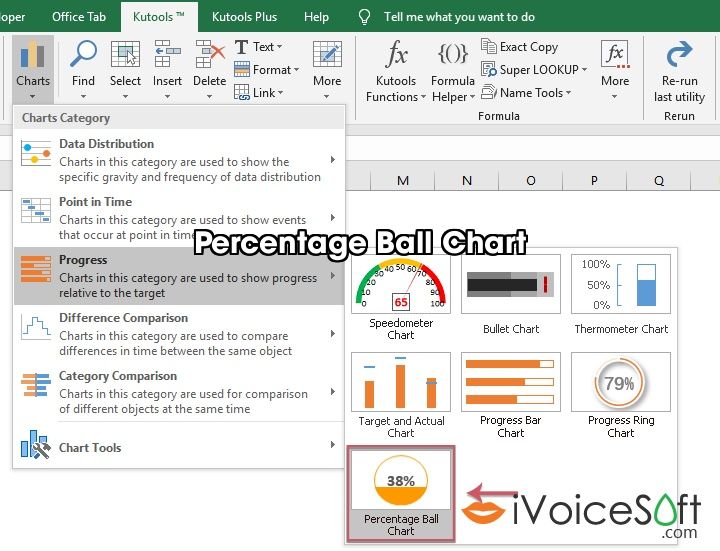
To insert a percentage ball chart for your need, please do as this:Click Kutools > Charts > Progress > Percentage Ball Chart, see screenshot:
1. Click Kutools > Charts > Progress > Percentage Ball Chart, see screenshot:
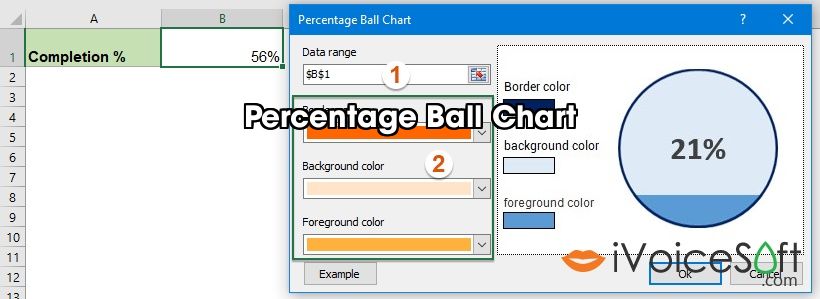
2. In the popped out Percentage Ball Chart dialog box:
- Select the cell contains the percentage value in the Data range section you want to create the chart based on;
- Specify a border color, background color and foreground color from the color drop down list separately.
(Tips: When you choose the color, the foreground color should be darker than the background color.)
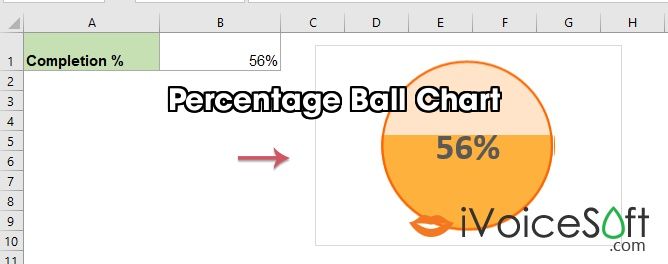
3. Then, click Ok button, the percentage ball chart will be inserted at once, see screenshot:
Notes:
1. When the cell value is greater than 1 or less than 0, a prompt box will pop out to remind you, and the chart will not be created correctly.
2. You can click the Example button in Percentage Ball Chart dialog box to open a new workbook with the sample data and sample Percentage Ball Chart.
>> Get the Kutools For Excel with the huge discount code HERE
And check out more coupon discount from Kutools HERE